Many administrators are familiar with the well-known “WIP Data Server” component of a SAS installation–so this blog takes a closer look at it, and shows how easy it is to monitor how large the database is growing. This data server contains a SAS-critical database known as the SharedServices Database, which is used internally by SAS applications for storage and sharing of information.
The first thing to realize is that there may be several other instances of postgreSQL within a given installation, each containing one or more databases that are specific to a solution; for example, there exists a Job Monitoring Data Server, a Data Remediation Data Server, a Data Management Data Server, and more. Here we will just discuss the familiar one, called the “Web Infrastructure Platform Data Server”, or WIP Data Server for short. Anything said here should apply to the others too.
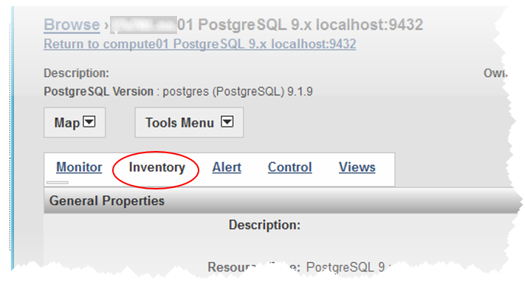
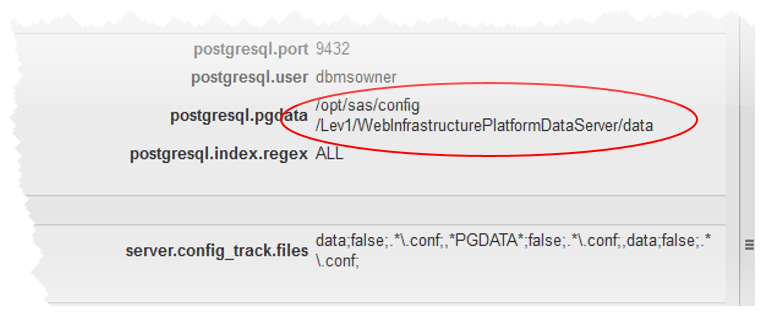
If you have an installation with more than one postgreSQL server, first determine the one that is the WIP Data Server. After logging in as an administrator (sasadm@saspw usually), go to the Resources->Browse page and select the Servers level in the resource hierarchy. Looking among the servers with names like “…PostgreSQL_9.x<machine>:port” , locate the one listening on port 9432 (the default), and then check the configuration directory to be sure–open the resource by clicking on it and observe the config directory from the Inventory page, as shown here:
bottom right corner of screen:
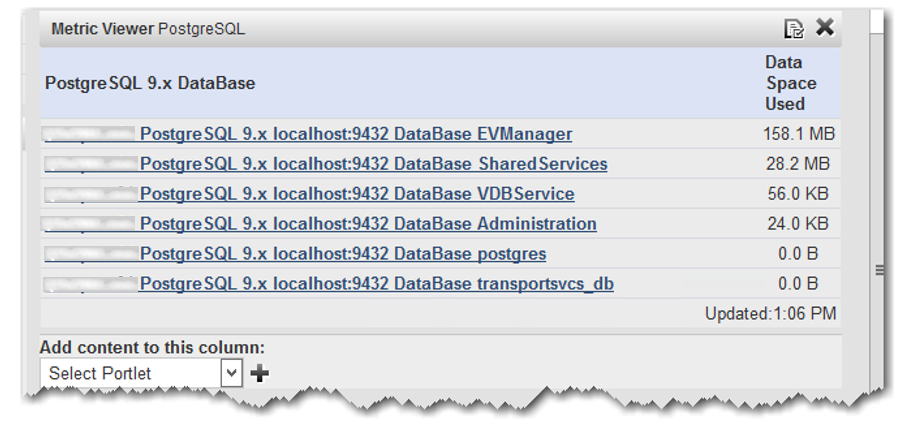
First, let’s review the various databases contained in the “SAS WIP Data Server”:
- EVManager (main storage for metrics collected by SAS EV (ACM, Agent Collected Metrics)
- Administration (Used by SAS EV to store information about SAS Metadata, which are part of the Administration menu
- SharedServices (Internal use by SAS Web Applications)
- VDBService (used by the Visual Analytics Administrator)
- transportSVCS (Visual Analytics Transport Service, used by SAS Mobile BI)
- postgres (default, not normally used)
Notice that these six databases are also listed on that same Inventory page, mid-page under the Services heading.
The postgreSQL database server is not configured by default (it’s the only server that you have to manually configure), so the first order of business is to perform the configuration. From the Resources->Servers page, you first select the server, then select the Inventory page, then go to Configuration Properties at the bottom. Click the Edit button and you will see this screen:
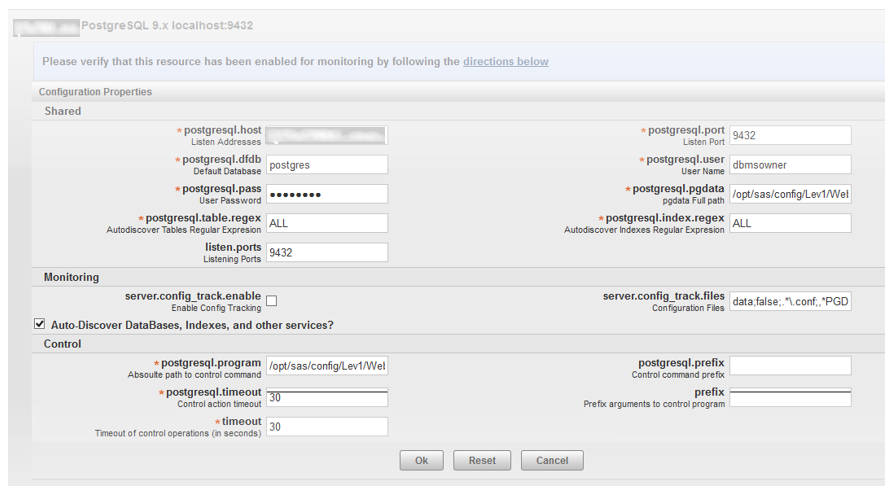
You can then fill in the appropriate values for the following (my values are listed here for an example):
| Listen Addresses | xxxxxxx01.xxx.xxx.com |
| Listen Port | 9432 |
| Default Database | Postgres |
| User Name | Dbmsowner |
| User Password | xxx123 |
| Absolute path to control command | /opt/sas/config/Lev1/WebInfrastructurePlatformDataServer/webinfdsvrc.sh |
If you want to monitor individual database tables and indexes, then make sure you have specified the “ALL” parameter the following two fields (illustrated above):
Autodiscover Tables Regular Expression
Autodiscover Indexes Regular Expression
When finished, make sure you click the OK button to save the changes.
After the server has been running a few minutes, you should be able to observe the two (or three) groups of services that it contains, shown in this screenshot with the database and the Monitor tab selected:
- Databases
- Tables
- Indexes (optional)
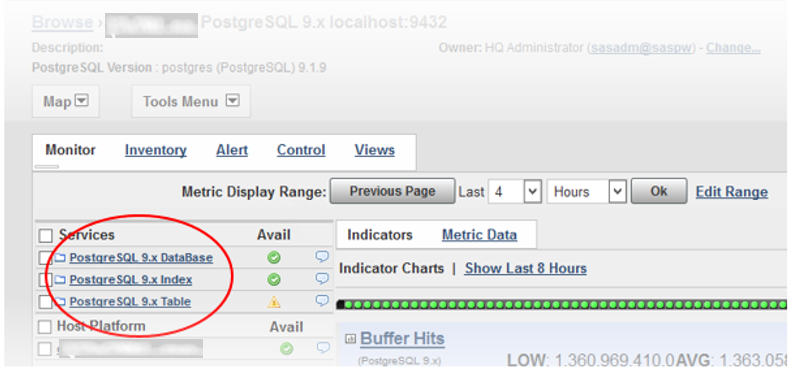
Now on to displaying disk usage for the database. You can select either the database resource itself (PostgreSQL 9.x DataBase) or, after selecting that, select one of the Databases within (Administration, EVManager, etc.). Scrolling through the various metrics and you will find one called: Data Space Used, indicating the size (in KB or MB) of that particular database on the disk.

Since these databases usually grow for the first couple of weeks of use and then their size levels off, they don’t often overwhelm their space. However, it’s nice to be able to regularly monitor their size, and it’s easily done from the dashboard, like this:
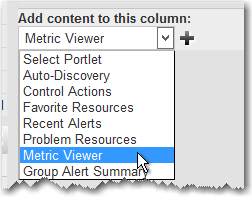
1. Log into the SAS EV as an administrator, and open the Dashboard interface. On the bottom of the right column, in the “Add content to this column” portlet, choose the Metric Viewer option in the dropdown list and click on the plus “+” sign to add the portlet
2. Select the configure button (upper right corner of the Metric Viewer portlet), and fill out the following properties:
a. Description: PostgreSQL
b. Resource Type: PostgreSQL 9.x DataBase
c. Metric: Data Space Used
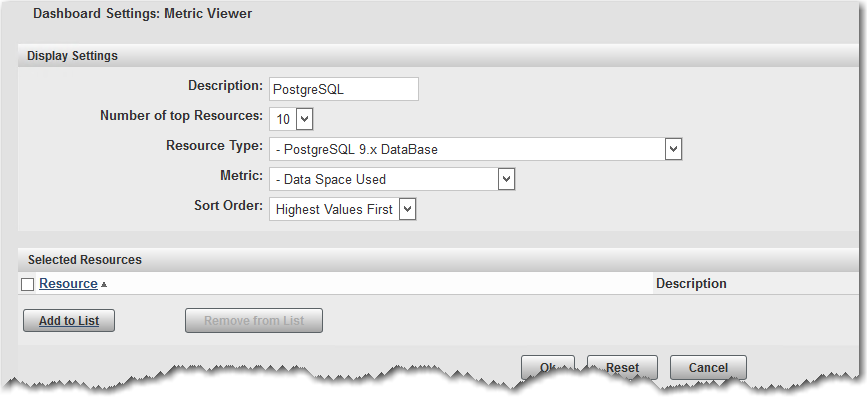
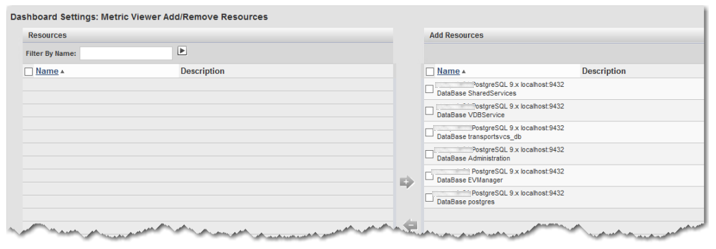
3. Click the Add to List button, and then select all the databases listed, move them to the right using the right arrow to select them:
4. Click the OK button, then click another OK button to finish.
5. You are now presented with an additional listing of each database, showing total MB of space used. Knowing your total disk space on the compute01 server, (in this case, it’s approx. 67 GB total) you have a good idea of how much of that is being taken up by your databases--in this case, approx. 186 MB out of approx. 67 GB on the disk total.